Market Update for Copeland Park
September 24th 2026: There were 42 homes sold in the Copeland Park neighbourhood in the last 12 months vs 56 last year. The average price for a home was $499,376, down by 4.5% over last year and it took 24 days for homes to sell versus 28 days last year.
Average Prices by Property Type
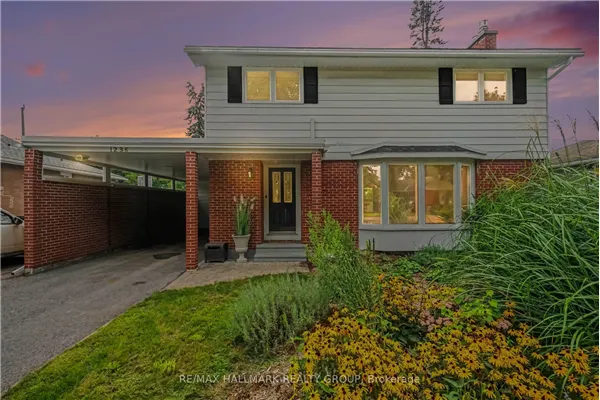
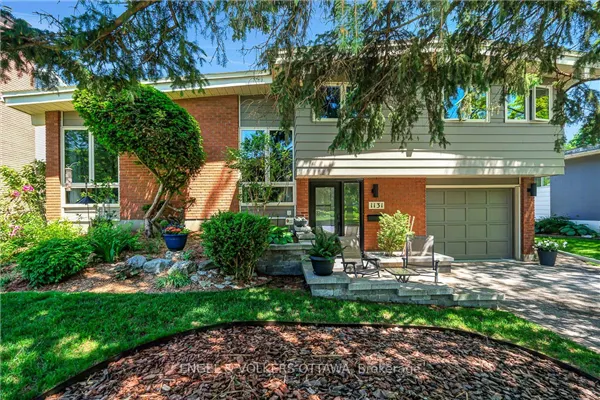
- The average price for a Detached Single-Family home in Copeland Park was $773,877.
- The average price for a Townhouse was $564,512.
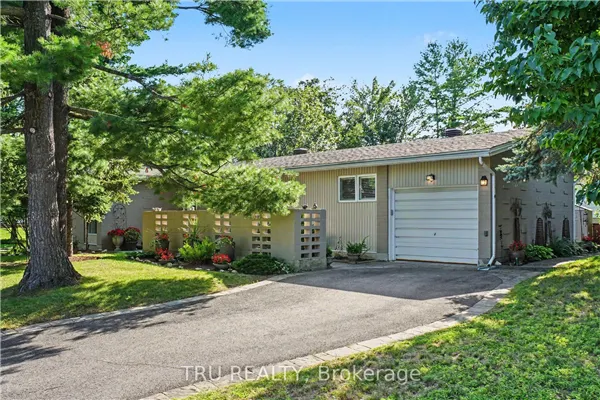
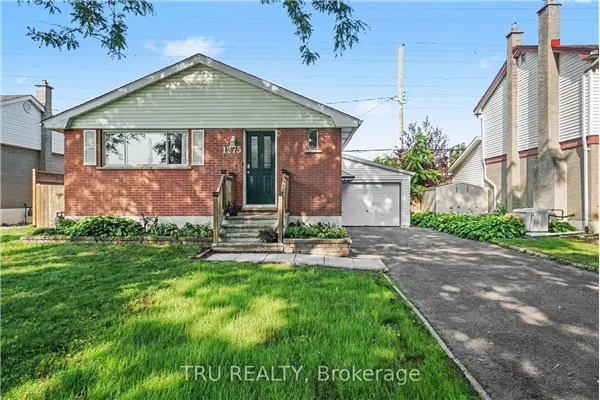
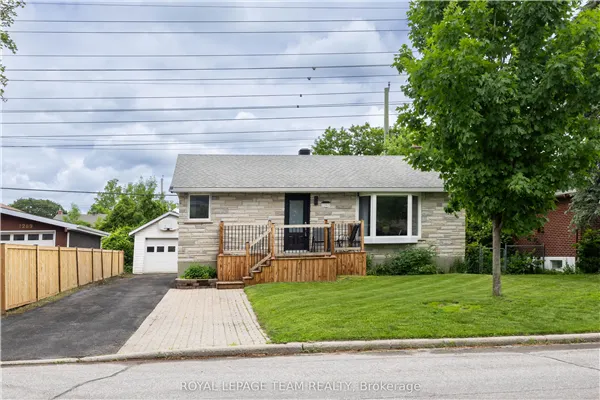
- The average price for a Bungalow was $664,583.
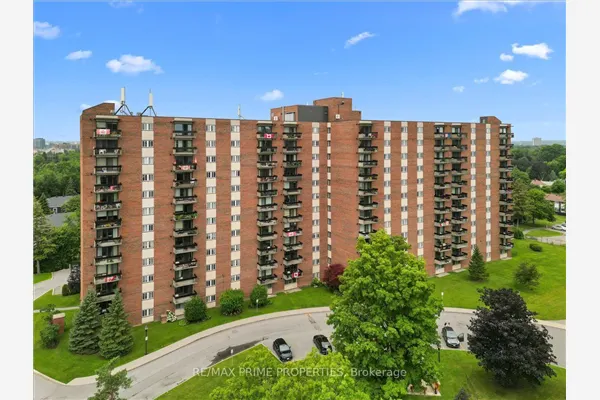
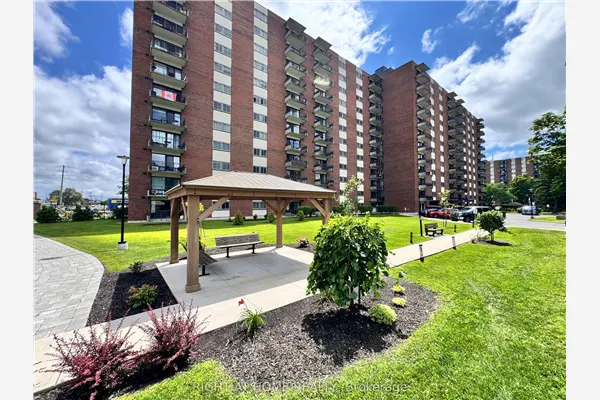
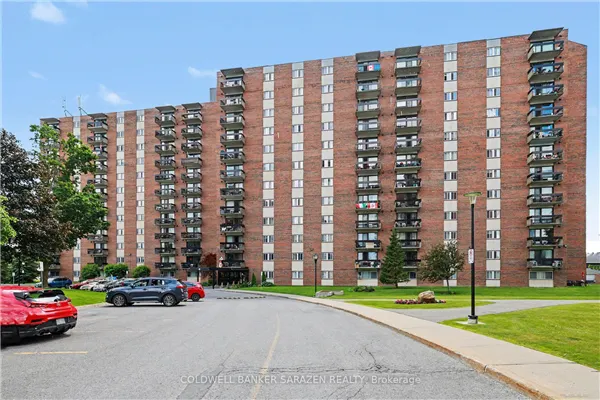
- The average price for a Condo was $316,445.
Copeland Park Historical Average House Prices
Historical home prices for Copeland Park going back as far as 2000, with the percent change each year
| YEAR |
AVERAGE PRICE |
% CHANGE |
| 2000 |
$137,611 |
|
| 2001 |
$164,997 |
19.9% |
| 2002 |
$181,102 |
9.8% |
| 2003 |
$183,709 |
1.4% |
| 2004 |
$213,184 |
16% |
| 2005 |
$216,415 |
1.5% |
| 2006 |
$214,851 |
-0.7% |
| 2007 |
$225,912 |
5.1% |
| 2008 |
$229,652 |
1.6% |
| 2009 |
$258,907 |
12.7% |
| 2010 |
$274,041 |
5.8% |
| 2011 |
$286,239 |
4.4% |
| 2012 |
$290,060 |
1.3% |
| 2013 |
$297,064 |
2.4% |
| 2014 |
$295,149 |
-0.6% |
| 2015 |
$299,466 |
1.5% |
| 2016 |
$279,070 |
-7.3% |
| 2017 |
$311,174 |
11.5% |
| 2018 |
$328,791 |
5.6% |
| 2019 |
$353,999 |
7% |
| 2020 |
$458,487 |
29.7% |
| 2021 |
$519,471 |
13.3% |
| 2022 |
$520,489 |
0.2% |
| 2023 |
$455,175 |
-12.5% |
| 2024 |
$485,100 |
6.6% |
| 2025 |
$537,165 |
10.7% |
Home prices in Copeland Park have increased in 22 years since 2000 and decreased in 4 years. The average home price in 2025 was $537,165 after an increase of 10.7%.
Homes for Sale in Copeland Park
View all MLS Listings in Copeland Park
About Copeland Park
The Copeland Park neighbourhood is bounded by Agincourt to the east, Clyde Avenue to the west, Baseline Road to the north and is south of the Queensway, with a population of approximately 4,200 people.
The SmartCentres Ottawa (Laurentian Place) plaza at Baseline and Clyde is a short distance away and has a Walmart Supercentre, fast food restaurants, personal care services and banks.
There is a mix of residential homes and high-rise condo apartments. We provide the history of average house prices for this neighbourhood right after the real estate listings.
Copeland Park sees around 60 to 70 home sales per year on average, with a high of 78 in 2019. Since 2000 this neighbourhood has seen 3 years where prices went down, and 2 of these years were not even 1%, but in 2016 we saw a decline of 7.3%. This recovered in 2017 with a healthy increase of over 7%, and in 2021, the average price shot up almost 30%.
Schools in the neighbourhood include: Agincourt Public School, Tancook Bell School and Algonquin College, farther down Baseline Road.