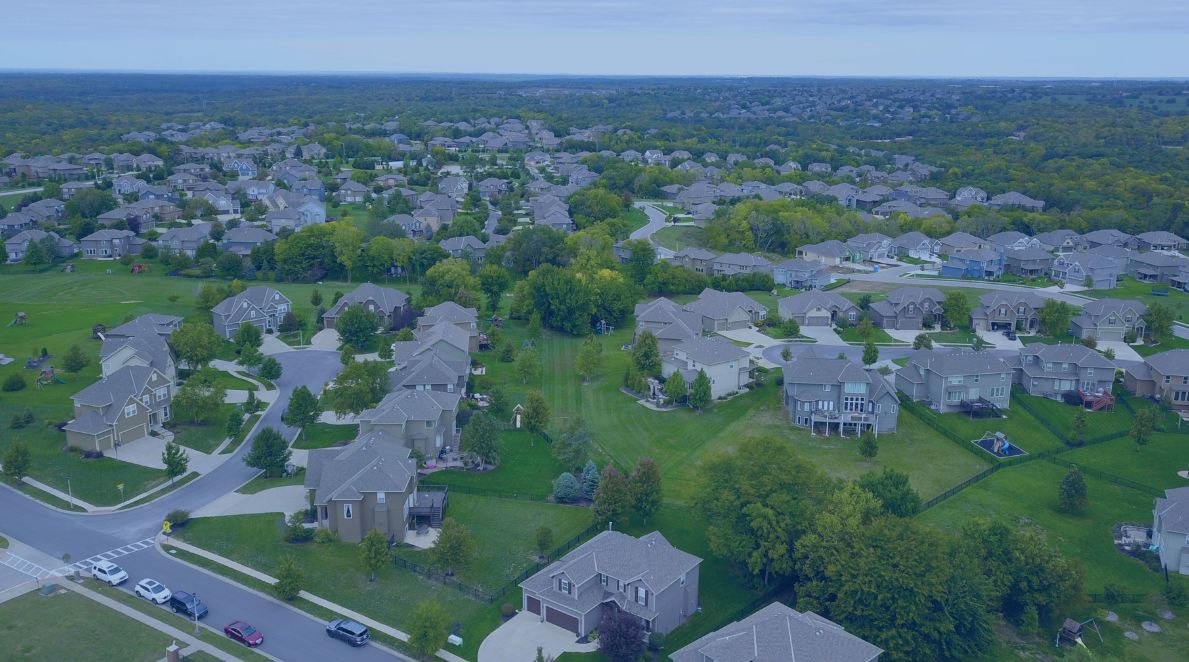
House Prices in the Outskirts near Ottawa
View Sold Listings & Historical Prices in some of the Outskirts around and near Ottawa. If you live in any of these outskirts, or are thinking about moving here, this page is a great resource for current and historical pricing for all the neighbourhoods.
We give you the average price, the percent change over last year and how long homes took to sell in each neighbourhood. You can also see the average price by the type of home, Single Detached, Townhomes, Condos and Bungalows where available.
South-West Outskirts Market Reports
Market Update for Outskirts South-West of Ottawa
September 7th 2026: There were 613 homes sold in these Outskirts South-West of Ottawa in the last 12 months vs.729 last year. The average price was $568,217, up 0.4% and it took 43 days for homes to sell versus 42 days last year.
Notable Stats for the Outskirts South-West of Ottawa
- 2 of the neighbourhoods are up in average price and 3 are down.
- Most sales were in Carleton Place with 224 homes selling.
- Highest average price was in Richmond at $715,452.
- Biggest increase in average price was in Carleton Place where homes went up by 3%.
West Ottawa Outskirts Market Reports
Market Update for Outskirts West of Ottawa
September 7th 2026: There were 531 homes sold in these Outskirts West of Ottawa in the last 12 months versus 532 last year. The average price was $693,114, down 2.8% and it took 41 days for homes to sell versus 40 days last year.
Notable Stats for the Outskirts West of Ottawa
- 1 of the neighbourhoods is up in average price and 3 are down.
- Most sales were in Arnprior with 173 homes selling.
- Highest average price was in Carp and Huntley at $924,733.
- Biggest increase in average price was in Arnprior where homes went up by 1.3%.
South Ottawa Outskirts Market Reports
Market Update for Outskirts South of Ottawa
September 8th 2026: There were 732 homes sold in these Outskirts South of Ottawa in the last 12 months versus 823 last year. The average price was $900,628, up 5.8% and it took 46 days for homes to sell versus 43 days last year.
Notable Stats for the Outskirts South of Ottawa
- 3 of the neighbourhoods are up in average price and 1 is down.
- Most sales were in Kemptville with 294 homes selling.
- Highest average price was in Manotick at $1,181,147.
- Biggest increase in average price was in Manotick where homes went up by 7.3%.
East Ottawa Outskirts Market Reports
Market Update for Ottawa East Outskirts
September 8th 2026: There were 803 homes sold in the Outskirts East of Ottawa in the last 12 months versus 920 last year. The average price was $648,618, down by 1% and it took 46 days for homes to sell versus 48 days last year.
Notable Stats for the Outskirts to the East of Ottawa
- 3 of the neighbourhoods are up in average price and 3 are down.
- Most sales were in Russell and Embrun with 269 homes selling.
- Highest average price was in Cumberland at $1,034,874.
- Biggest increase in average price was in Navan where homes went up by 16.3%.
View Market Reports for All Neighbourhoods in Ottawa