CFB & Area Historical Average House Prices
Historical home prices for CFB and area, with the percent change each year
| YEAR | AVERAGE PRICE | % CHANGE |
| 2011 | $348,921 | 10.1% |
| 2012 | $331,723 | -4.9% |
| 2013 | $341,950 | 3.1% |
| 2014 | $309,192 | -9.6% |
| 2015 | $342,430 | 10.8% |
| 2016 | $300,663 | -12.2% |
| 2017 | $394,500 | 31.2% |
| 2018 | $488,858 | 23.9% |
| 2019 | $425,555 | -12.9% |
| 2020 | $579,548 | 36.2% |
| 2021 | $677,047 | 16.8% |
| 2022 | $794,107 | 17.3% |
| 2023 | $632,862 | -20.3% |
| 2024 | $655,484 | 3.6% |
Want to know the average price for a Single Family Home, Townhouse, Condo or Bungalow in CFB and Area?
See the most recent Market Update for East End Neighbourhoods
Sold Listings in CFB and area
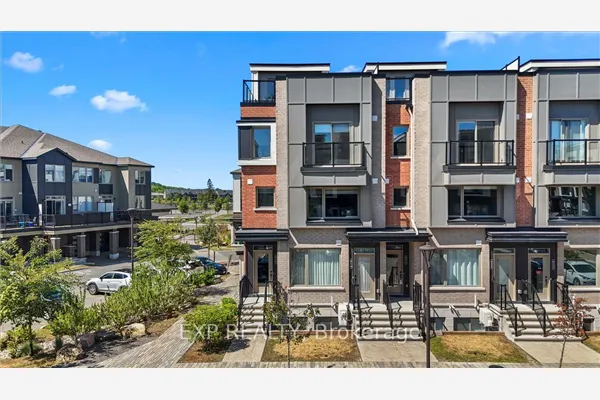
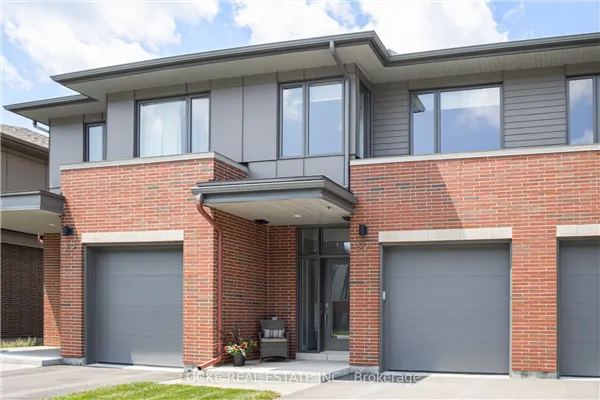
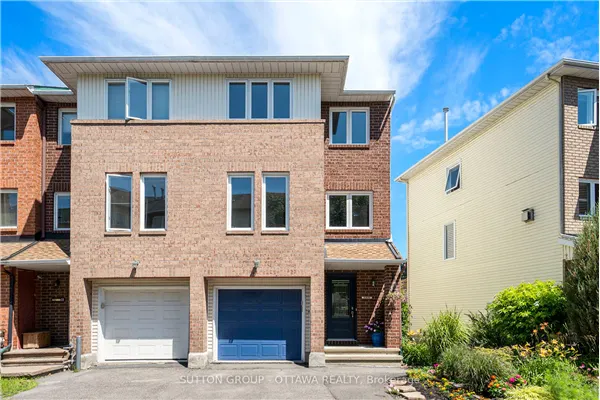
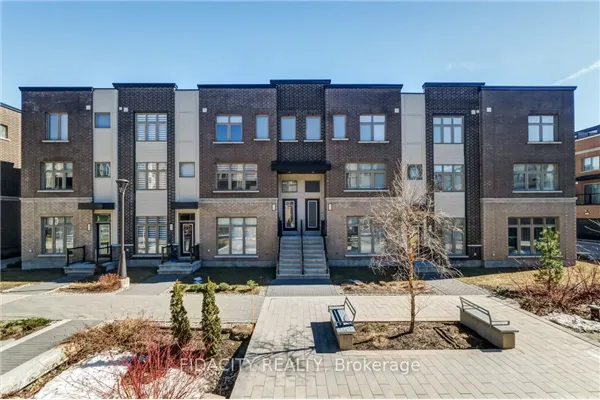
Below are the most recently sold listings in CFB and area, with the asking and sold prices.


