Carson Meadows Historical Average House Prices
Historical home prices for Carson Meadows going back to 2000, with the percent change each year
| YEAR | AVERAGE PRICE | % CHANGE |
| 2000 | $103,706 | % |
| 2001 | $129,020 | 24.4% |
| 2002 | $165,589 | 28.3% |
| 2003 | $193,158 | 16.6% |
| 2004 | $187,481 | -3.0% |
| 2005 | $219,472 | 17.1% |
| 2006 | $234,752 | 7.0% |
| 2007 | $231,140 | -1.6% |
| 2008 | $249,954 | 8.1% |
| 2009 | $275,870 | 10.4% |
| 2010 | $292,244 | 5.9% |
| 2011 | $318,185 | 8.9% |
| 2012 | $307,476 | -3.5% |
| 2013 | $354,704 | 15.4% |
| 2014 | $359,939 | 1.5% |
| 2015 | $287,122 | -25.4% |
| 2016 | $346,309 | 20.6% |
| 2017 | $380,317 | 9.8% |
| 2018 | $389,382 | 2.4% |
| 2019 | $376,537 | -3.3% |
| 2020 | $470,087 | 25% |
| 2021 | $481,771 | 2.5% |
| 2022 | $539,933 | 12.1% |
| 2023 | $458,561 | -15.1% |
| 2024 | $583,017 | 27.1% |
| 2025 | $518,840 | -11% |
Want to know the average price for a Single Family Home, Townhouse, Condo or Bungalow in Carson Meadows?
See the most recent Market Update for East End Neighbourhoods
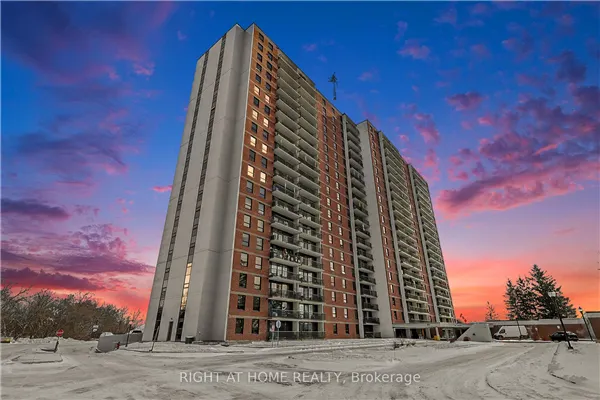
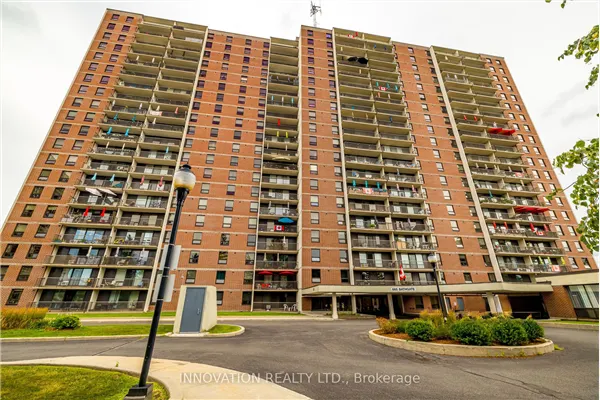
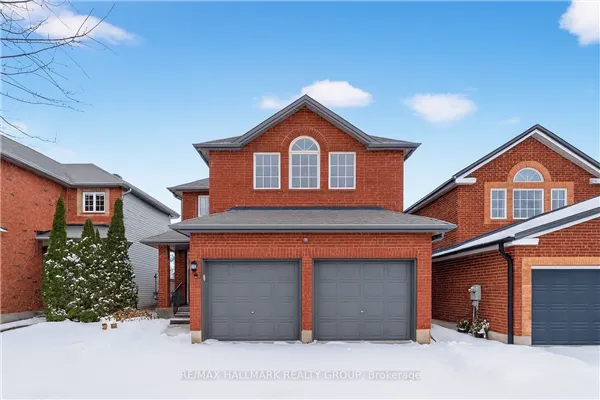
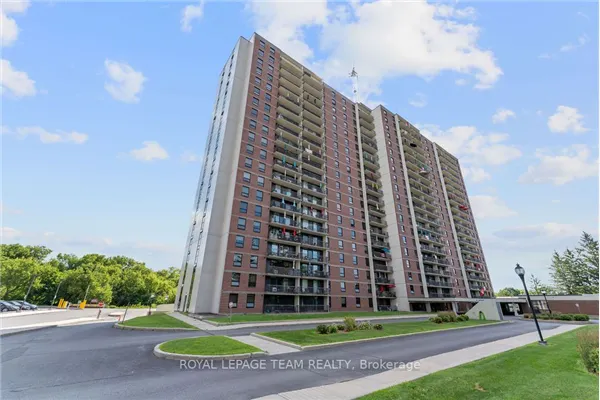
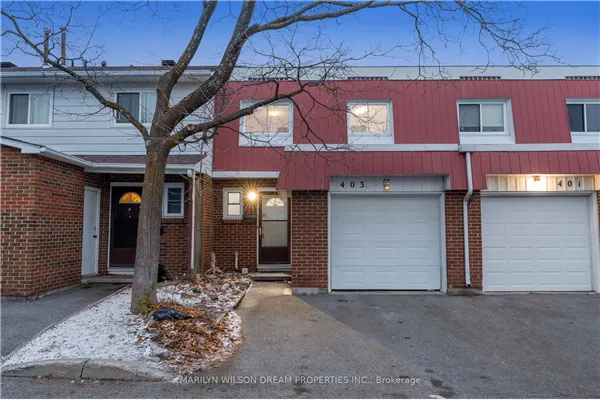
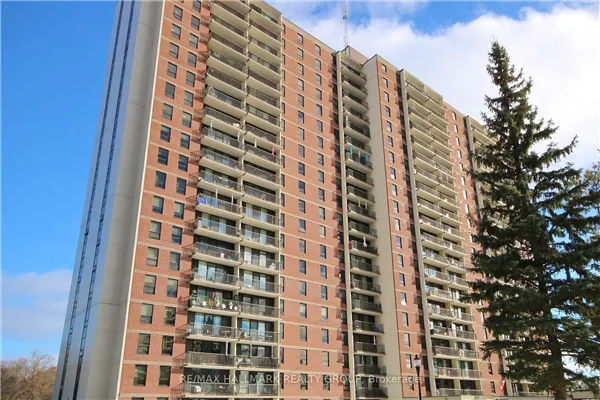
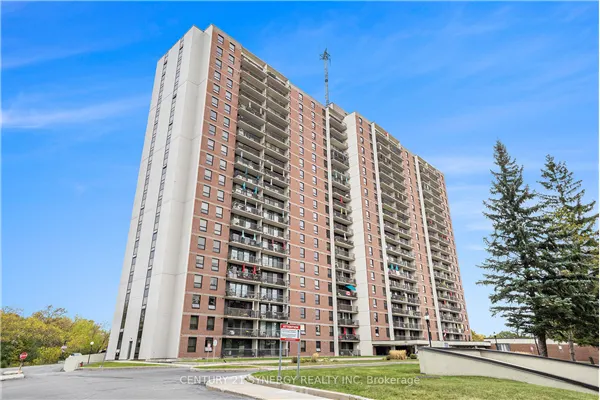
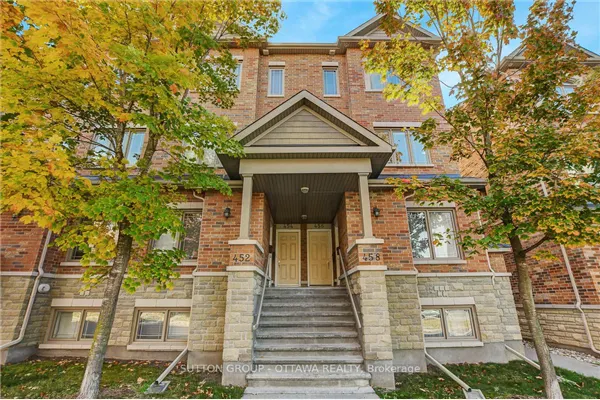
Sold Prices in Carson Meadows
Below are the most recently sold listings in Carson Meadows, with the asking and sold prices.


