Findlay Creek area Average House Prices
Historical home prices for Findlay Creek, Blossom Park going back as far as 2000, with the percent change each year
| YEAR | AVERAGE PRICE | % CHANGE |
| 2000 | $124,749 |
|
| 2001 | $111,852 | -11.5% |
| 2002 | $154,871 | 38.5% |
| 2003 | $189,157 | 22.1% |
| 2004 | $180,045 | -5.1% |
| 2005 | $210,764 | 17.1% |
| 2006 | $221,200 | 5% |
| 2007 | $271,921 | 22.9% |
| 2008 | $296,910 | 9.2% |
| 2009 | $326,556 | 10% |
| 2010 | $330,947 | 1.3% |
| 2011 | $347,716 | 5.1% |
| 2012 | $355,600 | 2.3% |
| 2013 | $376,200 | 5.8% |
| 2014 | $358,033 | -5.1% |
| 2015 | $371,799 | 3.8% |
| 2016 | $383,974 | 3.3% |
| 2017 | $408,395 | 6.4% |
| 2018 | $409,794 | 0.3% |
| 2019 | $447,852 | 9.3% |
| 2020 | $532,859 | 18.9% |
| 2021 | $659,462 | 23.8% |
| 2022 | $717,354 | 8.8% |
| 2023 | $668,730 | -6.8% |
| 2024 | $670,620 | 0.3% |
Want to know the average price for a Single Family Home, Townhouse, Condo or Bungalow in Findlay Creek?
See the most recent Market Update for South Ottawa Neighbourhoods
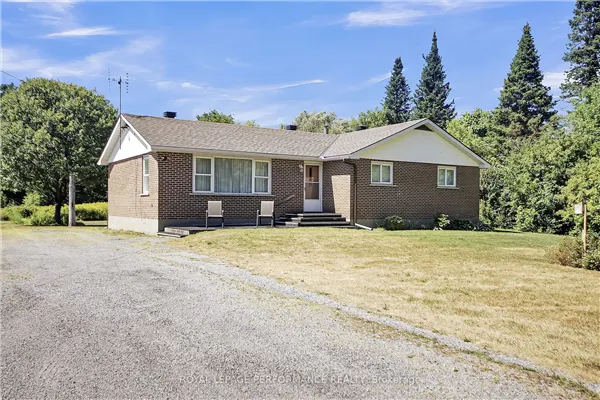
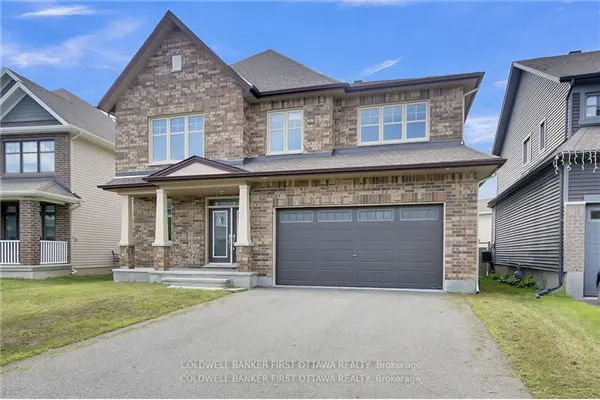
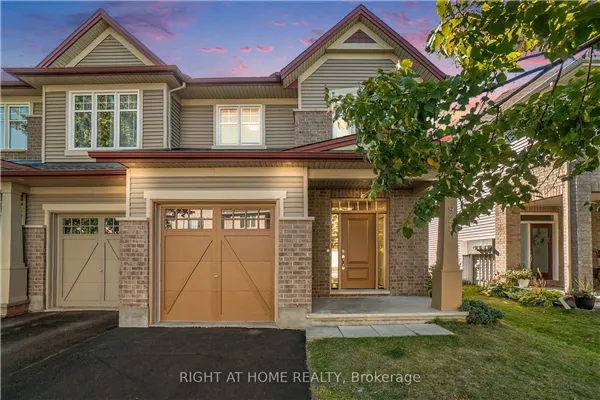
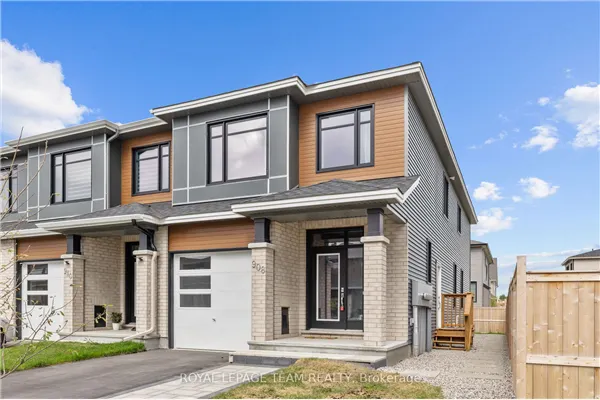
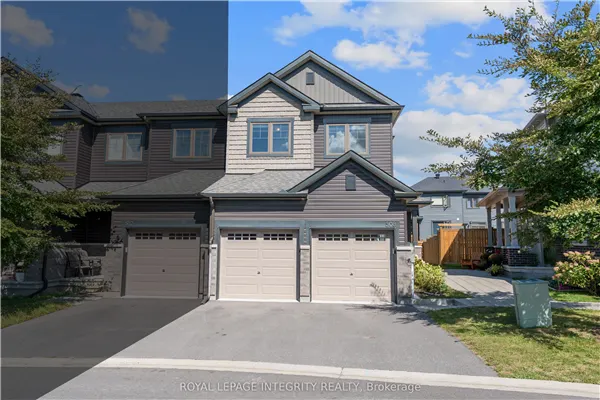
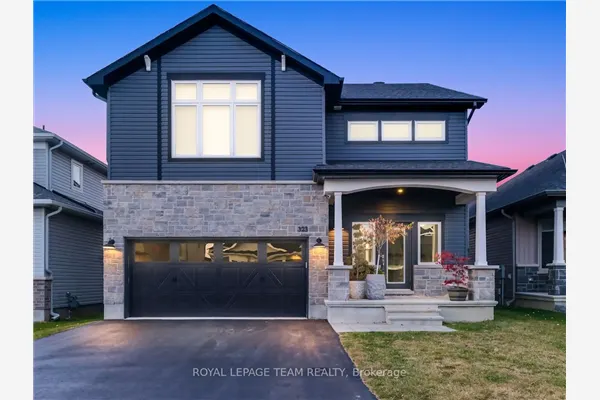
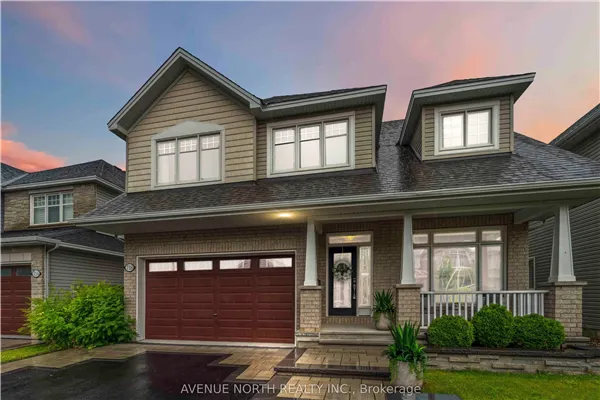
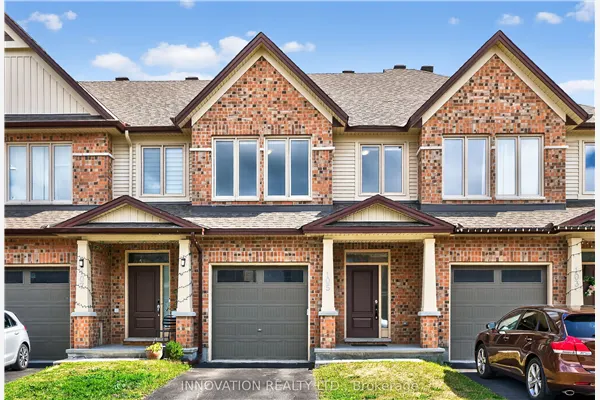
Sold Listings in Findlay Creek - Blossom Park
Below are the most recently sold listings in Findlay Creek and Blossom park, with the asking and sold prices.


