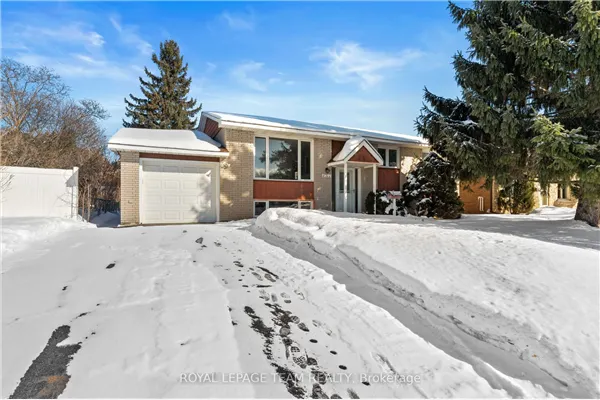
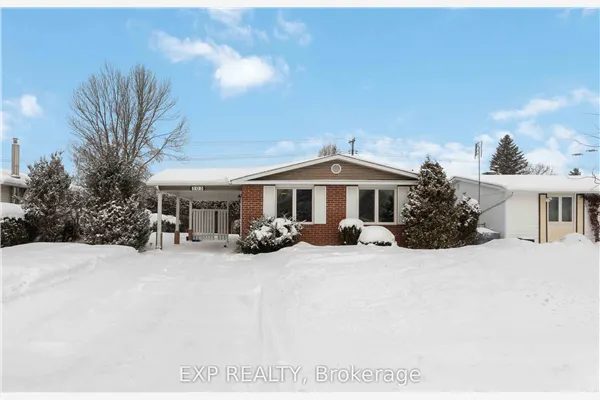
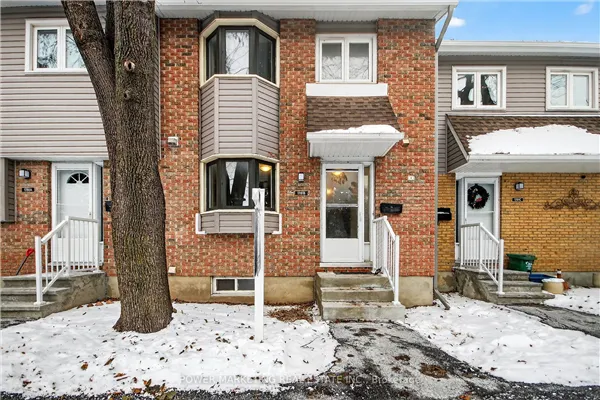
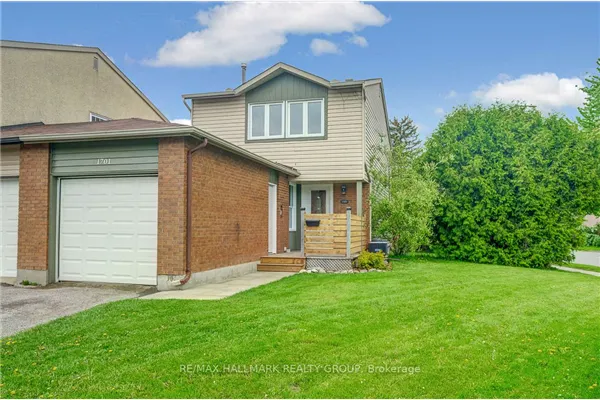
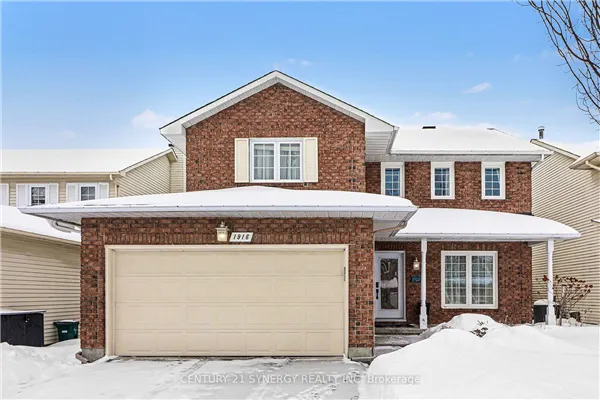
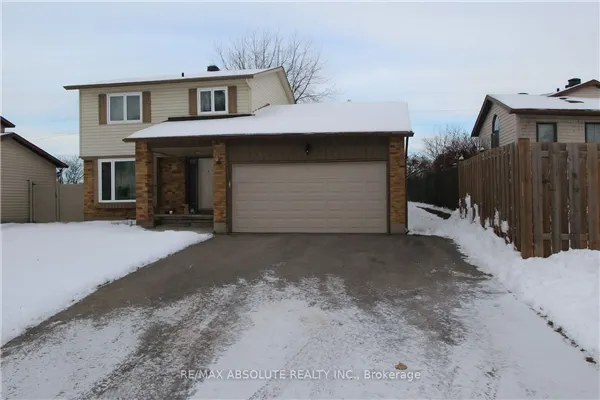
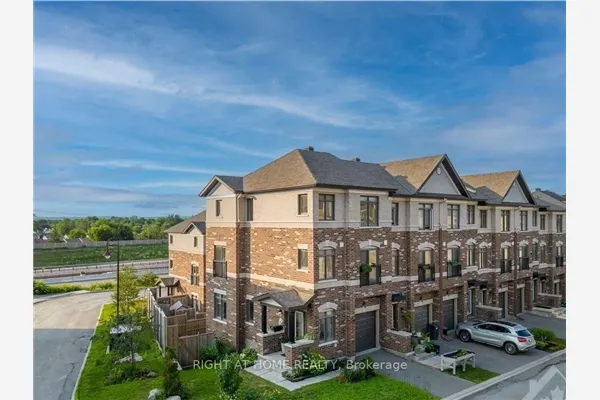
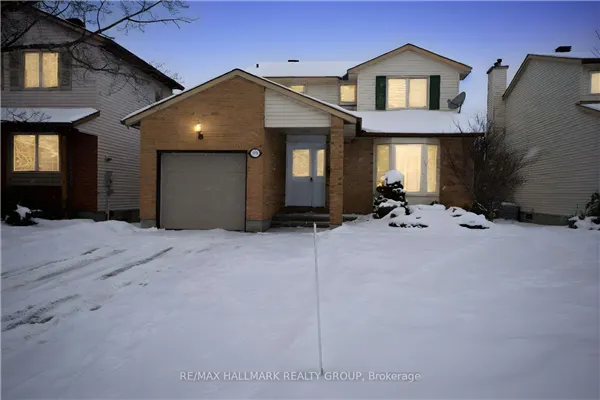
Homes for Sale in Queenswood Heights
View all MLS Listings in Queenswood Heights

About Queenswood Heights
The neighbourhood of Queenswood Heights has a population of 11,031 (at 2016 Census) and is a suburb of East Ottawa bounded by St. Joseph Boulevard north, Innes Road south and Tenth Line Road east. Listings here also include the smaller area called Bilberry Creek.
The Majority of homes in this neighbourhood are built by Sandbury, Tartan, Minto, Phoenix, Iber and Richcraft with condominiums built by Celestia and Gallivan. Residents have easy access to the Queensway and are able to travel downtown and other parts of the city with ease.
There are four elementary level schools located in the area:
- Our Lady of Wisdom Catholic School,
- École élémentaire catholique Reines-Des-Bois
- Dunning Foubert Elementary School
- La Source
Queenswood Heights features many walking trails and greenspace such as the Bilberry Creek Ravine trail and the Princess Louise trail. In 1980 the Queenswood Heights Recreation Association formed a sub-committee to develop a system of trails in the Cumberland Billberry Creek area to capitalize on and connect the foot trails across Orleans with the rapidly expanding areas of Queenwood Heights and Fallingbrook.
Best used from March to November, Billberry Creek Ravine Trails is a looped trail system that is 1.9 km and only moderately trafficked.


